I often wonder why news papers publish tables when a visual would be much better! Sigh…
The Washington Post analyzed the latest Medicare data (2012), released for the first time… ever. The article points out, “The top 10 doctors alone received a combined $121.4 million for Medicare Part B payments in 2012“, breaks down the spending by category and touts the high cost of drugs as the largest driver. Given the timing of the release, I suspect there’s already a plan by Democrats to show that their policies are working… the midterms are coming up and we already KNOW the central theme for Republicans is Anti-Obamacare (GOP 2014 Election Model).
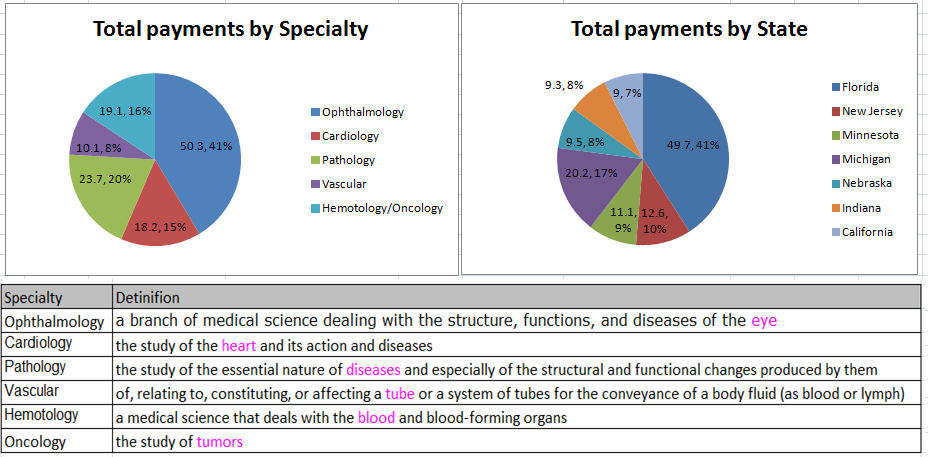
 Getting away from the politics, I’m more interested in the type of medical care being used. Keep in mind that back in 2012, the only people who received medicare were 65 years of age or older or disabled. To get to the bottom of the matter, see Exhibit A, along with a cheat sheet I created with the help of my friend Webster, Miriam Webster. Looking at the data, the most costly area relates to Ophthalmology (i.e. vision). Not a single doctor in the top 10 have anything to do with the typical ailments you’d expect for seniors – Alzheimer’s/Dementia, hip replacements, arthritis. (That’s not to say that analysis of the entire data set won’t yield such a conclusion.) What we can note is that almost 50% of the payments went to the state of Florida. You be the judge!